
On 22nd of May, the All Nepal Football Association (ANFA) disclosed the technical report of Qatar Airways Martyr’s Memorial ‘A’ Division League 2076 amidst a lively press conference. ‘The first of its kind report in South Asia’, as per ANFA President Karma Tsering Sherpa, is 80-page long and consists of league statistics in addition to department reports that surrounded the two-months long league.
While it’s good to see an initiative like this being taken, finally, the league report equally portrays ANFA’s shortcomings and inability to make the most out of what it has on his hands. In this article, we’ll look at the weaknesses of what could’ve been done to make the report astuter with the resources used by the technical team. Here we go.
Full of petty errors
“It can be beneficial for people who wish to analyze league and Nepali football.”
—- Ramesh Kumar Silwal (Secretary, Nepal Sports Council)
It could’ve been beneficial and useful. It’s not quite there, in any case.
For football lovers, the release of the technical report itself was a good move. However, the minor errors that occupy the report from the beginning to till end make the experience dull. Things are spread out everywhere, from spelling errors to processing errors. Yes, I cannot be too critical and bash the first attempt itself, but these are things that could’ve been avoided easily.
Let me take some examples of errors that I couldn’t ignore while going through the report. First of all, the indexes used on technical charts were vague and, most importantly, insufficient.
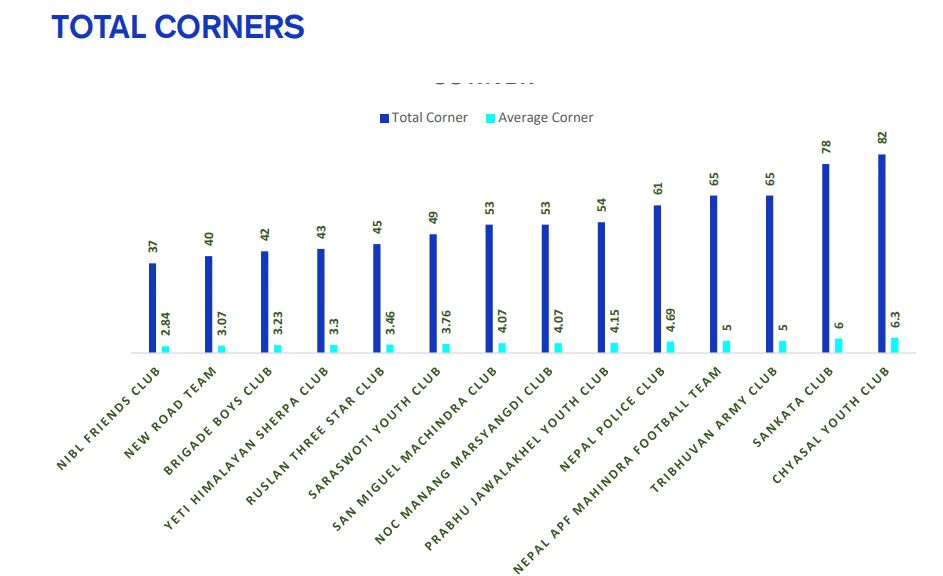
The Total Corners segment. What catches my eye is the ‘Average Corner’ index. With so much exposure to football data viz, I’ve noticed one thing in general – data viz. guys try to make their visualizations simple and keep their indexes and legends very clear. Throughout the technical report, only the term ‘average’ is used (average number of corners taken per match? or the average number of corners taken per half?). One needs to divide the total figure by the total number of games a club played in the league to realize it’s a per-game metric.
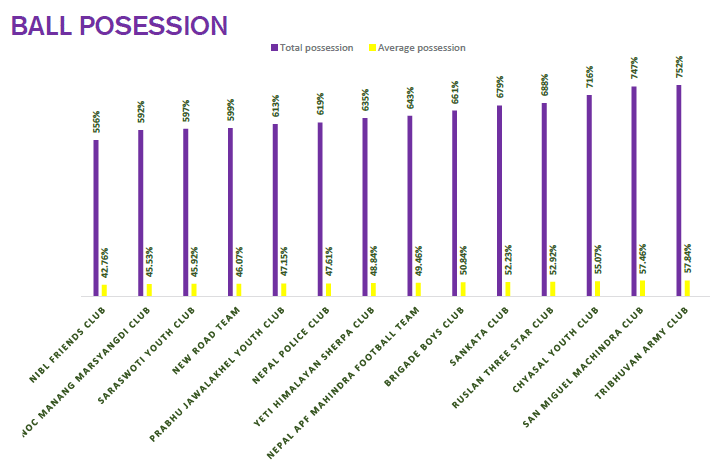
Similarly, the possession count segment has a metric ‘Total possession”, which is very vague, and I’d never seen it elsewhere. 556% of possession – WHAT?
This might seem too small to complain, but I believe things can always be improved. Other petty errors, like the error in calculations and club names, are all over the report. To everyone looking to get something out of the report, the question will always strike – if the data taking procedures were wrong or only miscalculations occurred in the process.
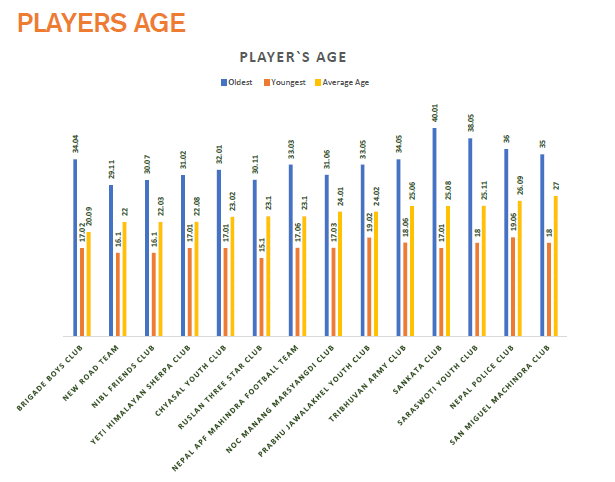
The age segment
There’s a segment in the technical report, that categorizes the participating clubs’ youngest and oldest players’ ages. This information itself is restricting, and it is not sufficient enough to draw any conclusion or analyze anything out of it. Although the average squad ages are mentioned, the segment fails to disclose enough data.
What could’ve been done instead:
I went online to search for participating players’ details and found nothing. This technical report, in itself, could’ve been a benchmark if it had included age of each player participating in the tournament.
In addition to that, disclosing players’ ages would’ve helped analysts too. Including players’ ages would’ve made it easier for the clubs to identify players’ condition by showing whether the player is peaking or has already enjoyed his prime. This would further help to create a recruitment strategy for clubs to execute transfers as well.
Here’s an example of what could’ve been done if there was a more detailed segment present:

Since I couldn’t find adequate information online as well, I made an age chart of Nepalese players that started against the Socceroos in the World Cup Qualifiers at Canberra. As we can see, I’ve divided the players into four categories as per their ages- developing, approaching the peak, peak, post-peak as per Barca Innovation Hub’s model. With this, we can identify four players that can be worked on, two players that are approaching their peak and four players that are at the height of their careers age-wise. Only 30-year-old Kiran Chemjong lies beyond the peak phase, as per the model.
This not only helps to recruit players but also keep an eye on the replacement for players that are beyond their peak years. Similarly, this can determine the overview of how well clubs are recruiting players, as per their playing style demands. I would’ve loved to carry out recruitment analysis of every club that played the A Division this year, but ANFA….
Counting the passes played
I was excited to see this metric somewhere inside the individual club’s profile in the report. However, I think more could’ve been done, with the resources that ANFA already had.
In the process of counting the total number of passes, the technical team could’ve just divided the pitch virtually into zones (for primary reference let’s take three – own third, central zone and the final third). Then, the team could’ve used the pass-count to sub-divide the number of passes played in each area by a competing team. If this had been done with a little bit of extra work, we could’ve had a point to analyze. With the density of passes divided into regions, we could’ve detailed if a team plays more lateral passes, forward passes or passes towards the back. Besides, it could’ve been used to determine the direction of play that a team prefers, as well as a rough insight on where the team takes more touches.
Goal-keeping metrics and detailed line-ups
As I scrolled through the report, it finished off without the segment I searched for the most – goalkeeping metrics. Since the number of shots were counted in each of the fixtures, the technical team could’ve pushed it slightly to determine the total shots faced by a goalkeeper, total shots faced by the keeper per 90 and total shots on target faced per 90. By recording the number of saves, we could’ve landed on a position to analyze save percentage, giving us a rough insight on the team’s and goalkeeper’s efficiency on goal (although this is not conclusive and there’s more to it, something could’ve been better than nothing).
Similarly, instead of using a plain share-my-tactics type of template to denoted teams’ formations, ANFA could’ve included the most-used players in the board. Since ANFA had a proper collection of each match’s team-sheets, this could’ve given us a peek of what teams looked like during the tournament.
ANFA’s Technical Report might have been a step in the right direction, but it shows everything that’s going on in Nepalese football – doing it just for the sake of it, not to look at the details and progress through the process.